

























What's in This Report
Fraud is getting harder to distinguish from ordinary digital activity. AI-generated scams blend into social feeds and messaging apps, while high-volume events concentrate traffic and give attacks more cover. This quarter's report combines a consumer survey with insights from the Sift Global Data Network to reveal a widening confidence gap between AI-generated scams and consumers' ability to spot them. For businesses, the risk extends beyond the initial attack. Topline improvement can conceal concentrated fraud activity, while customer trust depends on how quickly and clearly a company responds. Strong teams prepare for expected peaks, monitor for activity outside those periods, apply friction selectively, and make incident response part of their fraud strategy.
The Confidence Gap Behind AI-Generated Scams
53%
of consumers have encountered a scam using AI-generated images or video
36%
feel very or extremely confident they could identify one

01
Chapter 01
AI-Generated Scams Skyrocket
AI-enabled fraud isn’t an edge case. Among consumers who use social media or messaging apps, 53% have encountered a scam using AI-generated images or video. Retailers and e-commerce brands were impersonated most often, at 40%. By using familiar branding in fake product listings, delivery updates, and support interactions, these scams can leave businesses facing disputes, support costs, and lost trust even when they begin outside company platforms. Sumsub estimates that deepfakes now account for 11% of global fraud activity, and PwC expects deepfake-driven identity fraud to continue rising in 2026.
Fraud methods are also becoming easier to find and use. More than one-third of consumers have encountered social posts, groups, or channels that teach or sell fraud methods, while nearly one-quarter have tried a social media “hack” to exploit a refund, discount, or free-item policy. Fraud-as-a-service platforms give that activity an industrial backbone by selling subscription-based phishing kits that lower the expertise needed to launch convincing scams. Barracuda projects that global phishing losses will exceed $25 billion this year, increasing businesses’ exposure to refund, promotion, and policy abuse.
See the Full Report
Most Commonly Impersonated People and Organizations in AI-Generated Scams
e-commerce brand
influencer
support agent
institution
The Fraud Economy Is Operating in Plain Sight
Share of consumers who have engaged with fraud-enabling content on social platforms
Confidence Has Not Kept Pace With Exposure
Only 36% of consumers feel very or extremely confident they can spot AI-generated images, video, or text used in a scam. The largest group, 41%, feels only somewhat confident, while 23% has little or no confidence. As synthetic content becomes easier to produce and harder to distinguish from legitimate communication, businesses can't rely on consumers to catch every attempt on their own.
Consumer Confidence in Spotting AI-Generated Scams
Consumers Are Compensating on Their Own
Many consumers aren't waiting for businesses to solve the problem. Most have adopted at least one protective habit, led by monitoring bank or card statements, avoiding links from social or messaging apps, and enabling two-factor or multi-factor authentication. But fewer than half use unique passwords, verify sellers, or rely on a password manager. For businesses, those gaps reinforce the need to detect risks customers can't see without adding unnecessary friction.
Consumer Fraud-Protection Behaviors

02
Chapter 02
High-Volume Events Concentrate Risk Across Industries
Consumer spending activity clusters around a handful of high-volume moments, and fraud pressure often follows. Nearly two-thirds of consumers (64%) say they spend the most during the holiday and New Year season, while only 14% say their spending doesn’t spike at any particular time. Which moments matter most, and how attacks unfold, depends on the industry, region, and business model.
When Consumers Say They Spend the Most
Fraud Pressure Follows a Different Calendar in Every Industry
Fraud doesn't follow one universal calendar because each industry creates different opportunities for abuse, from tournament-driven betting and travel-booking windows to retail promotions, product launches, and regional demand surges. Over the past year, the highest overall fraud-pressure day was May 14, 2025, while industry peaks ranged from March through June 2025. These dates are useful benchmarks, not predictions. Fraud teams should compare them with their own traffic, declines, review queues, step-up activity, and delayed chargebacks to identify when normal demand is giving coordinated attacks room to hide.
Top Fraud-Pressure Days Across the Sift Global Data Network
Peak day per segment, in chronological order. Benchmarks, not predictions.
Topline Improvement Can Hide Concentrated Attacks
Across the Sift Global Data Network, the payment fraud attack rate fell 14% year over year to 2.8% in Q2 2026, while the manual review rate declined 13.5% quarter over quarter to 2.1%. But topline improvement does not show where risk is building. Network-wide metrics can remain stable while coordinated attacks accelerate against a particular merchant, card range, or transaction flow.
Over six weeks of anomaly monitoring across nine Sift merchants, 129 critical anomalies were detected, indicating significant departures from normal transaction and fraud patterns. A BIN is the first six to eight digits of a card number, identifying its issuer and card range; BIN attacks test numbers within that range to find valid cards. These attacks accounted for 82% of the anomalies, with 58 distinct BINs targeted. Another 15% were card-testing attempts priced to match a merchant's typical order size, or fired off in rapid bursts of very small charges to validate many stolen cards at once, and the remaining 3% were chargeback-rate spikes.
Payment Fraud Block Rate By Industry (Q1 2025 to Q1 2026)
Payment fraud attack rate Payment fraud attack rate Average blocked payment fraud rate by quarter
Average blocked payment fraud rate by quarter
E-Commerce: Card Testing Hides in Ordinary Traffic
Digital Commerce's payment fraud attack rate fell 29% year over year, from 2.1% to 1.5% in Q2 2026 across the Sift network. But that improvement didn't eliminate concentrated attacks against individual merchants. Over 11 straight days, a global fashion marketplace recorded 47 critical anomalies, every one tied to a BIN-attack pattern spanning 34 distinct BINs, with one BIN alone crossing the detection threshold eight times.
At a multinational beverage brand, the same low-value, high-frequency card-testing signature appeared independently across storefronts in six countries over nearly four weeks. It wasn’t a single coordinated hit, but multiple, independent hits committed by different coordinated groups, scaling attacks across multiple markets. The two cases show why teams need to connect BIN, account, order-value, and geographic signals over time. A concentrated 11-day burst at one merchant and a slower, multi-market pattern at another can reflect the same underlying tactic, even when each individual transaction looks ordinary on its own.
Software & Services: Sustained Attacks Don’t Follow a Calendar
The Software & Services payment fraud attack rate rose from 2.7% in Q1 2026 to 3.8% in Q2, returning to its Q2 2025 level. At the merchant level, a design and creative tools platform recorded 58 critical anomalies across more than 41 consecutive days, affecting 22 distinct BINs. Instead of spiking around a launch or seasonal event, the activity persisted: a reminder that event-based planning isn't enough for platforms with continuous access and transaction activity.
iGaming: Major Tournaments Raise the Stakes
iGaming's payment fraud attack rate rose nearly ninefold from a low base, from 0.066% in Q2 2025 to 0.58% in Q2 2026, ahead of this year's World Cup. Nearly one-third of respondents said they bet more or used an iGaming or prediction market platform more frequently during a high-volume event, and 33% named the World Cup as the event they'd most recently bet on. With global tournament wagering forecast to exceed $50 billion, operators need to prepare for surges in deposits, bets, and post-event withdrawals well before kickoff.
Fraud pressure also moved downstream during the tournament. Registration remained relatively stable despite higher sign-up volume. But dormant accounts were reactivated to allow bad actors to move money; fraudulent withdrawals shifted toward fewer, higher-value attempts. Real-time account, payment, device, behavioral, and velocity signals can help teams detect that movement without disrupting legitimate bettors.
Where Recent Sports Wagers Were Placed
Travel & Ticketing: World Cup Scams Move to Social Channels
Travel & Ticketing’s payment fraud attack rate fell 67% year over year across the Sift network, from 5.5% to 1.8% in Q2 2026, but payment data doesn’t capture every threat. Ahead of the World Cup, Sift observed Telegram channels impersonating travel-booking and FIFA ticketing services. The channels advertised discounts of up to 50%, used official-looking branding and fabricated confirmations, then directed consumers to private messages. These off-platform scams can create disputes, drive up support costs, and result in lost trust before consumers ever reach a legitimate site.
Adjacent vendors in the same space aren’t immune from industry-wide backlash resulting from these types of attacks. In November of 2022, FTX’s highly-covered collapse triggered a run on unrelated exchanges, including a reported $70 million in withdrawals from Crypto.com in a single weekend, despite Crypto.com having no involvement in the FTX incident.
Similar impersonation tactics were surfacing across other digital channels. Check Point Research recorded 9,741 World Cup-related domains in April 2026, more than five times the 2022 tournament’s peak, with roughly 1 in 41 identified as malicious. Group-IB also tracked a threat actor operating more than 300 fraudulent FIFA domains, while the FBI warned that spoofed sites were stealing personal information and selling fake tickets.
Telegram Channels Impersonating World Cup Ticketing & Travel Brands
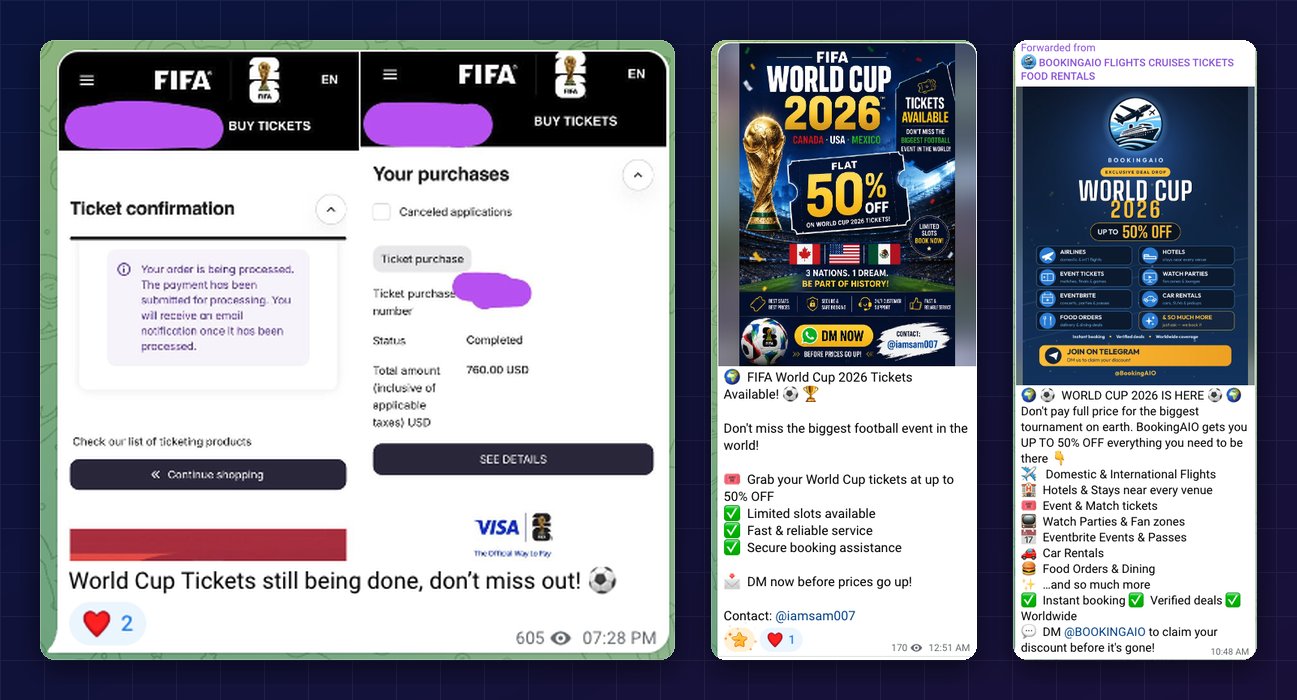
Screenshots of Telegram channels impersonating travel-booking and FIFA ticketing services ahead of the World Cup, observed by Sift.

Fraud pressure can hide beneath a stable network average, spike around a major event, or build quietly for weeks. The teams best positioned to respond know what normal looks like for their industry and connect activity across the customer journey. That context helps them stop coordinated abuse without sacrificing legitimate revenue or customer trust.
Kevin Lee
Field Chief Technology Officer, Sift

03
Chapter 03
The Same Fraud Rate Can Carry a Very Different Cost
A fraud rate alone doesn’t show what’s at stake. In Q2 2026, industry averages ranged from $14 in Food & Delivery to $391 in Travel & Ticketing, meaning the same attack rate can represent vastly different loss exposure. False positives carry the same variability: the average cost was $124, ranging from $22 in Food & Delivery to $335 in iGaming.
+52%
Average order value increased 52% year over year to $128 across the Sift Global Data Network, raising the stakes behind every fraud decision.
Average Order Value vs. Cost of a False Positive, by Industry
04
Chapter 04
Fraud Incidents Are Now a Customer Retention Problem
Fraud can damage customer relationships even when an incident does not affect every user directly. More than half of consumers (58%) say learning that a company experienced a large-scale fraud attack would decrease their trust. That loss of confidence also changes behavior: 47% have stopped using a company or reduced their use after a fraud experience, including 26% who left entirely.
How a Large-Scale Fraud Incident Affects Trust
The Response Determines Whether Trust Survives
A fraud incident doesn't determine whether trust survives. The response does. A clear explanation improves perception for 73% of consumers, while vague or incomplete communication worsens it for 69%. Proactive outreach and fast resolution also help rebuild confidence, making incident response a direct part of the retention strategy.
Improves Perception
Worsens Perception

05
Chapter 05
What Leading Teams Do Next
Customers should understand what happened, what the company is doing, and what comes next without having to chase for answers. That context helps teams block compromised payment instruments without penalizing every linked account. It also helps them use rising support tickets to identify when trusted customers are being blocked, while monitoring chargebacks for signs that too much fraud is getting through.
Connected context matters because familiar signals can be manipulated. A joint FBI and Google operation dismantled a residential proxy network built from roughly 2 million hijacked home devices, allowing credential attacks to resemble ordinary household traffic. IP address and location can’t reliably indicate risk without supporting account, device, and behavioral data.
Identity signals are becoming harder to trust as agentic commerce grows. Forrester describes synthetic “Frankenstein” identities that combine real and fabricated information to pass static identity checks, while Akamai reports AI shopping agents being used for automated carding attacks. Teams will need to assess identity, intent, and behavior continuously, from account creation through checkout and beyond, to distinguish legitimate automation from fraud.
Building Readiness Into Every Peak Event

Before the Event
Identify the events, products, and customer journeys most likely to face increased fraud pressure.
Align fraud, product, operations, and support teams on risk tolerance and escalation paths.
Test automated decisions and step-up authentication before traffic increases.

During the Surge
Monitor approval rates, block rates, review queues, support tickets, and velocity anomalies in real time.
Watch for coordinated attacks hiding within legitimate traffic.
Adjust protections dynamically while keeping trusted customers moving.

After the Event
Review fraud losses, false positives, customer friction, and response times.
Monitor delayed disputes and chargebacks.
Apply lessons from the event to the next playbook.
*On behalf of Sift, Researchscape International polled 1,043 adults (aged 18+) across the United States via online survey in August 2026.
Discover More From Sift

Drive Your Fraud Strategy Forward With FIBR
Compare your performance against Sift benchmarks with the Fraud Industry Benchmarking Resource (FIBR) and uncover fraud trends across industries, regions, and key metrics.