The Q3 2025 update to Sift’s Fraud Industry Benchmarking Resource (FIBR) is now live, and this quarter’s data tells a story of shifting tactics and major differences between industries.
As a Trust & Safety Analyst, I spend my days tracking these patterns to understand where fraudsters are innovating and where defenses are holding strong. FIBR gives us the high-level context behind those shifts so we can see what’s normal, what’s new, and what might be coming next.
Here’s what the latest data reveals.
Key Takeaways
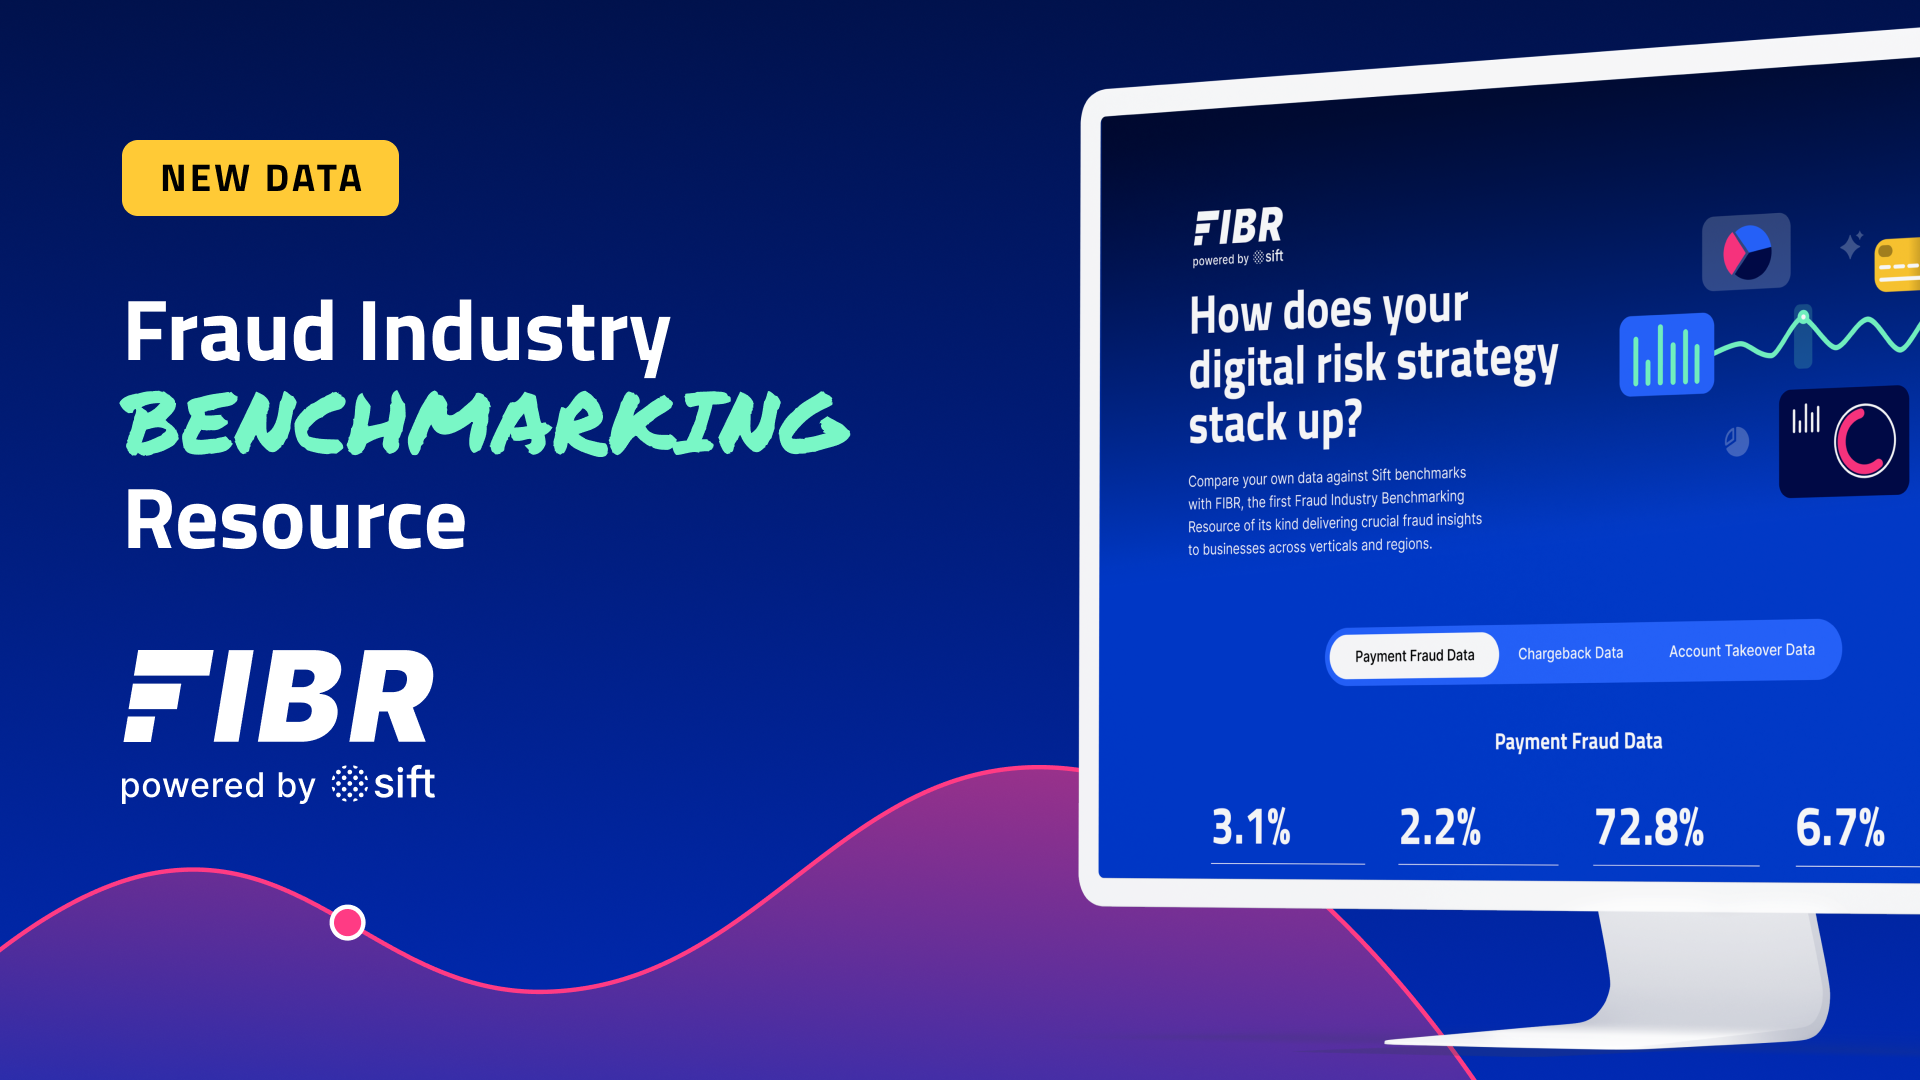
- Payment fraud attack rate remained stable at 3.1% overall, with a 6% year-over-year decline
- Manual review rate dropped 21% YoY to 2.2% in Q3 2025
- 72.8% of fraudulent payments were made by credit/debit card
- Cryptocurrency fraud surged 110% YoY, making it the riskiest payment method this quarter with a 6.7% fraud rate
- Chargebacks tell a mixed story: general chargebacks rose 24% YoY, but fraudulent chargebacks fell 25%
- Account takeovers declined 55% YoY, supported by a 10% increase in 2FA adoption
The State of Fraud in Q3 2025
Payment Fraud: Consistent Rates, Evolving Tactics
The payment fraud attack rate has remained fairly steady this year, but dipped slightly in Q3 2025, down 6% YoY from 3.3% to 3.1%. Manual review rates also dropped, from 2.8% to 2.2%, suggesting that trust and safety teams are leaning further into automation to manage scale without slowing the customer experience.
The overwhelming majority of fraudulent payments (72.8%) still come from credit or debit cards, but the 6.7% cryptocurrency fraud rate stands out. At just shy of 7%, it’s the highest of any payment type, highlighting a trend of attackers moving into newer payment methods that have fewer guardrails. Even as AI-driven defenses grow more precise, fraudsters are experimenting faster, especially in emerging payment ecosystems.
Chargebacks: Disputes are Rising, Fraudulent Claims Falling
Chargeback data tells a nuanced story this quarter, with general chargebacks rising 24% year-over-year (0.21% → 0.26%) while fraudulent chargebacks fell 25% (0.28% → 0.12%).
This trend points to two key dynamics: merchants are getting better at documenting and disputing false claims, and consumers—facing ongoing economic pressure—are more likely to initiate first-party fraud disputes. The takeaway is that not all increases in chargebacks are signs of fraud; however, they remain costly, and proactive refund communication can prevent many from escalating to formal disputes.
Account Takeovers: ATOs down, 2FA Paying Off
The biggest drop this quarter came in account takeover (ATO) attacks. Rates dropped 55% YoY (1.3% → 0.59%), while 2FA adoption rose 10% (7.1% → 7.8%).
We’re seeing a clear cause-and-effect relationship here, where more layered authentication leads to fewer takeovers. But ATO remains volatile; attackers often go dormant and then reemerge with new automated or AI-powered approaches. As always, preparation matters more than prediction. If you wait for the next wave to appear, it’s already too late.
Industry Trends: Where Fraud is Heating Up
Fraud doesn’t hit every sector the same way. Here’s what stood out this quarter across key verticals:
Digital Commerce
The payment fraud attack rate rose 43% YoY (1.6% → 2.3%) across digital commerce, but still remains below the overall average of 3.1%. Manual reviews dropped from 4.9% to 3.3%, reflecting growing trust in automated decisioning.
Fraud tactics are shifting as AI-generated listings, deepfake sellers, and agentic bots drive new forms of first-party and reseller fraud, especially in high-value categories like luxury and trending goods (e.g., Labubus). Merchants should focus on refining identity and behavioral signals to separate trusted users from synthetic ones.
Commerce marketplaces specifically were also hit hard, with payment fraud attack rates up 40.7% YoY (2.7% → 3.8%). As these platforms grow, they’re seeing more first-party fraud, often fueled by social media “refund fraud” trends.
Travel & Ticketing
The travel and ticketing industry continues to strengthen account security even as it faces a rise in chargebacks. Account takeover (ATO) attacks are down 59% year-over-year, while two-factor authentication (2FA) adoption has increased 25%, reaching a 12% adoption rate—the highest across all industries. While stronger authentication is clearly making a difference, chargebacks are trending upward, reflecting a tougher refund environment. The challenge for travel businesses now lies in maintaining this higher level of verification without adding unnecessary friction for trusted, repeat travelers.
Food & Delivery
Fraud in food delivery is highly seasonal and spikes predictably in Q4. In 2024, rates climbed 30% from Q3 (3.0%) to Q4 (3.9%), and we expect to see a similar lift this year with the return of major sporting events and holidays. Because manual review rates are so low in this category, automated risk detection is essential to prevent fraudsters from exploiting busy order windows.
How to Use FIBR
Whether you’re in trust and safety, fraud operations, or risk strategy, FIBR helps you see your numbers in context. The public version of FIBR is open to anyone, offering key attack rates and benchmarks by industry.
For Sift customers, you can access the public-facing FIBR as well as in-console and on Sifters. Sift users can access FIBR insights within the Sifters customer community, complete with more in-depth metrics, including median order amount and fraudulent order amount trends by industry, plus chargeback reasons by industry. All customers can access their FIBR report by logging into the Sift Console and going to Insights.