Fraud benchmarking can be elusive for fraud and risk teams. They might not know what metrics to track or how to track them, or the context surrounding the data may not be clear. Sift has been at the forefront of solving this challenge with its Fraud Industry Benchmarking Resource—providing publicly accessible fraud insights to businesses across verticals and regions.
Now, we’re giving Sift customers the ability to access and compare FIBR data to their own numbers directly within the Sift Console.
Delivering Up-to-Date Fraud Performance Comparisons with FIBR In-Console
FIBR in-console makes it easier for customers to compare their own data against industry benchmarks. With easily navigable, intuitive controls, customers can see their own payment fraud, manual review, and chargeback rates in comparison to the Sift Global Network and their specific industry.
The new capability offers instant access to deeper understanding of fraud performance relative to industry and global benchmarks directly within the Sift Console, delivering more intuitive experience for risk analysts that no longer requires toggling between locations for benchmarking data. Direct comparisons are now a click away, with a company’s unique chargeback and block rates pre-populated right alongside FIBR data.
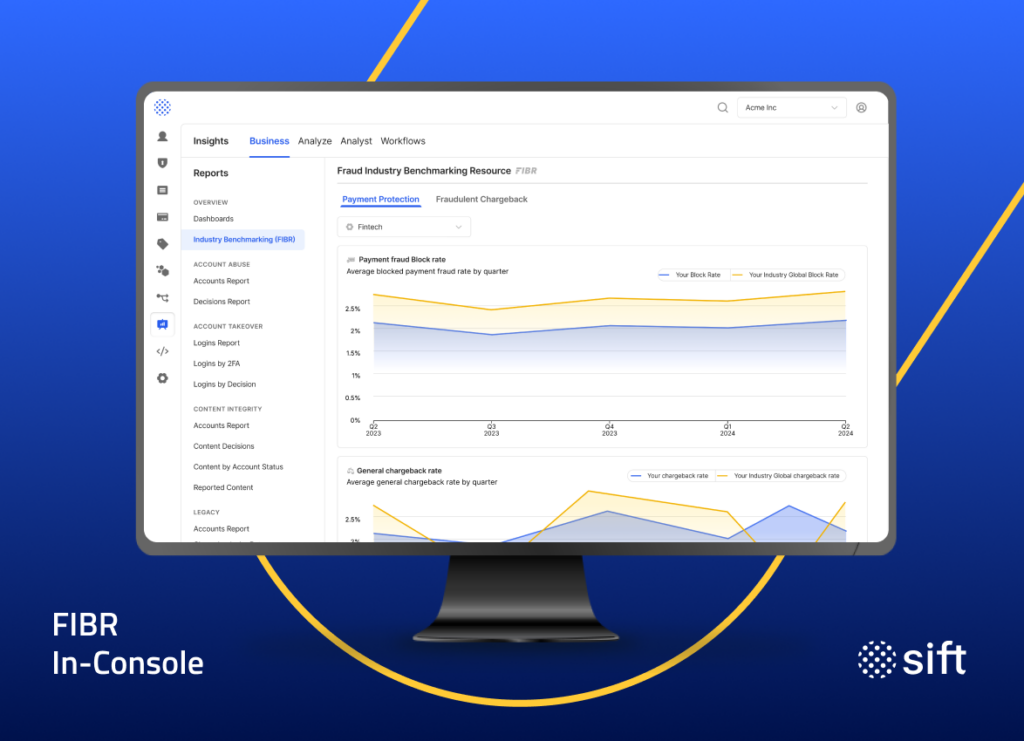
FIBR in-console data is now available for Payment Protection customers, providing payment fraud attack rate, manual review rate, general chargeback rate, and fraudulent chargeback rate. Risk teams can benchmark and adjust their fraud strategies faster and more confidently, with:
- Less time spent trying to benchmark fraud performance
- More informed decisions about risk thresholds and fraud operations
- Clarity into performance compared with Sift’s Global Data Network and industry cohorts
Q1 2025 Fraud Insights: Recent Trends
A new year means new fraud trends, and updated data for Q1 2025 is now available in FIBR web. These extensive insights provide valuable context into the challenges and trends faced by various industries.
Across the Sift Global Data Network, the overall payment fraud attack rate increased by over 6%. From Q4 2024 to Q1 2025, it grew from 3.2% to 3.4%. The average manual review rate, however, spiked nearly 23% QoQ, from 2.3% to 2.8%.
Seasonality has had an obvious impact at the industry level. The below data highlights how key verticals fared in Q1 2025. By understanding these vertical-specific trends and challenges, fraud and risk professionals can better prepare and implement strategies to combat fraud effectively.
Travel & Ticketing
- Payment fraud rates were 5.0%, 47% higher than the all-network average of 3.4% in Q1 2025
- Manual reviews rose 43% QoQ, from 3.9% to 5.6%
- ATO attack rates rose 24% QoQ, from 3.3% to 4.1%
Retail E-Commerce
- Payment fraud attack rate increased 14% QoQ, from 1.4% to 1.6%
- Manual review rates shot up 25%, from 2.8% to 3.5%
Fintech & Finance:
- Payment fraud attack rates increased over 20% QoQ, from 3.4% to 4.1%
- Manual reviews increased 33% QoQ, from 1.5% to 2.0%
- Overall chargeback rates increased 66% QoQ, from 0.18% to 0.3%
3 Ways to Interact with FIBR
There are now more ways to interact with FIBR than ever before. FIBR is publicly available to anyone looking for fraud benchmarking data. Sift customers have access to the public-facing FIBR as well as in-console and on Sifters.
Sift users can access FIBR insights within the Sifters customer community, complete with more in-depth metrics, including median order amount and fraudulent order amount trends by industry, plus chargeback reasons by industry.
All customers can access their FIBR report by logging into the Sift Console and going to Insights.