Part 1 focused on the challenge, architecture and anomaly sensor, in this part let’s talk about the alerter and the console components.
Alerter
Alerter is a standalone service, which listens to a Kafka topic for anomaly signals.
Once a Sensor reports an anomaly, Alerter decides if a user should be informed or not. The Alerter’s job is to transform the stream of anomalies into a small number of notifications, where user involvement is suggested.
Deduplication
The same anomaly might be re-triggering for a prolonged period of time. To make UX better, the Alerter opens a single alert for the first time it sees a new anomaly for a customer, then folds ongoing anomalies into that alert for a cooldown window. Only after the window passes without a recurrence does the next occurrence create a new alert.
transaction {

      existingAlert = findOpenAlert(customerId, anomalyType)

      if (existingAlert != null && existingAlert.snoozedUntil > now) {

          // still within the cooldown window — fold this occurrence in

          existingAlert.linkOccurrence(signal)

          existingAlert.snoozedUntil = now + snoozeDuration

      } else {

          // window expired (or no prior alert) — start a new one

          createAlert(customerId, anomalyType, signal, snoozedUntil = now + snoozeDuration)

      }

  }
For anomaly types that naturally arrive as a burst of related signals (e.g. BIN attack), the Alerter waits a short period to collect the series before sending the first notification, so the full context is present in the initial message.
if (signal.segmentType != NONE) {

      scheduleNotification(alert, deliverAfter = now + coalesceWindow)

  } else {

      scheduleNotification(alert, deliverAfter = now)

  }
Exactly-one delivery
The pipeline (Ingestion -> Sensor -> Alerter) is at-least once, since it’s based on Kafka. Alerter owns the “exactly-one” delivery part.
The duplicate signals part is covered by deduplication. A redelivered message collides with a record that’s already there:
try {

      transaction {

          recordOccurrence(alert.id, signal.id) // fails if (alert.id, signal.id) already recorded

          maybeCreateOrLinkAlert(signal)

      }

  } catch (AlreadyExistsException e) {

      // exact redelivery of a signal we've already processed — safe to ignore

      metrics.increment("duplicate_signal_skipped")

      return

  }
The race between “alert recorded” and “notification queued” is covered on database level by making delivery scheduling idempotent:
if (!deliveryAlreadyScheduled(alert.id, channel)) {

      scheduleNotification(alert, channel)

  }
On the sending side, each channel’s delivery attempt moves through a small state machine, so retries update state in place and do not send a second copy:
switch (attemptDelivery(delivery)) {

      case SUCCESS -> markDelivered(delivery)

      case TRANSIENT_FAILURE -> markRetryLater(delivery, backoff(delivery.attempts))

      case PERMANENT_FAILURE -> markFailed(delivery)

  }
Pluggable notification-channel interface
The Alerter itself only decides that something should be sent and when. Every dispatcher implements the same small interface:
interface NotificationChannel {

      ChannelType channelType()

      void sendAlert(Alert alert, ChannelConfig config)

  }
The dispatcher resolves which channels are enabled for a customer and anomaly type and calls each matching implementation.
Initially only Console Dashboard and Email dispatchers are implemented.
Config and lifecycle as a gRPC surface
Two internal gRPC services are available so the product UI can manage the alerts via BE for FE:
- Lifecycle: acknowledge, snooze, resolve an alert and attach analyst feedback to a resolved one.
- Configuration: per-customer control over which channels are enabled, per-anomaly-type overrides and cooldown/snooze tuning, merged against system-wide defaults.
That feedback loop feeds back into how we calibrate sensitivity per customer over time, tightening or loosening thresholds based on how often an alert type turns out to be a real problem.
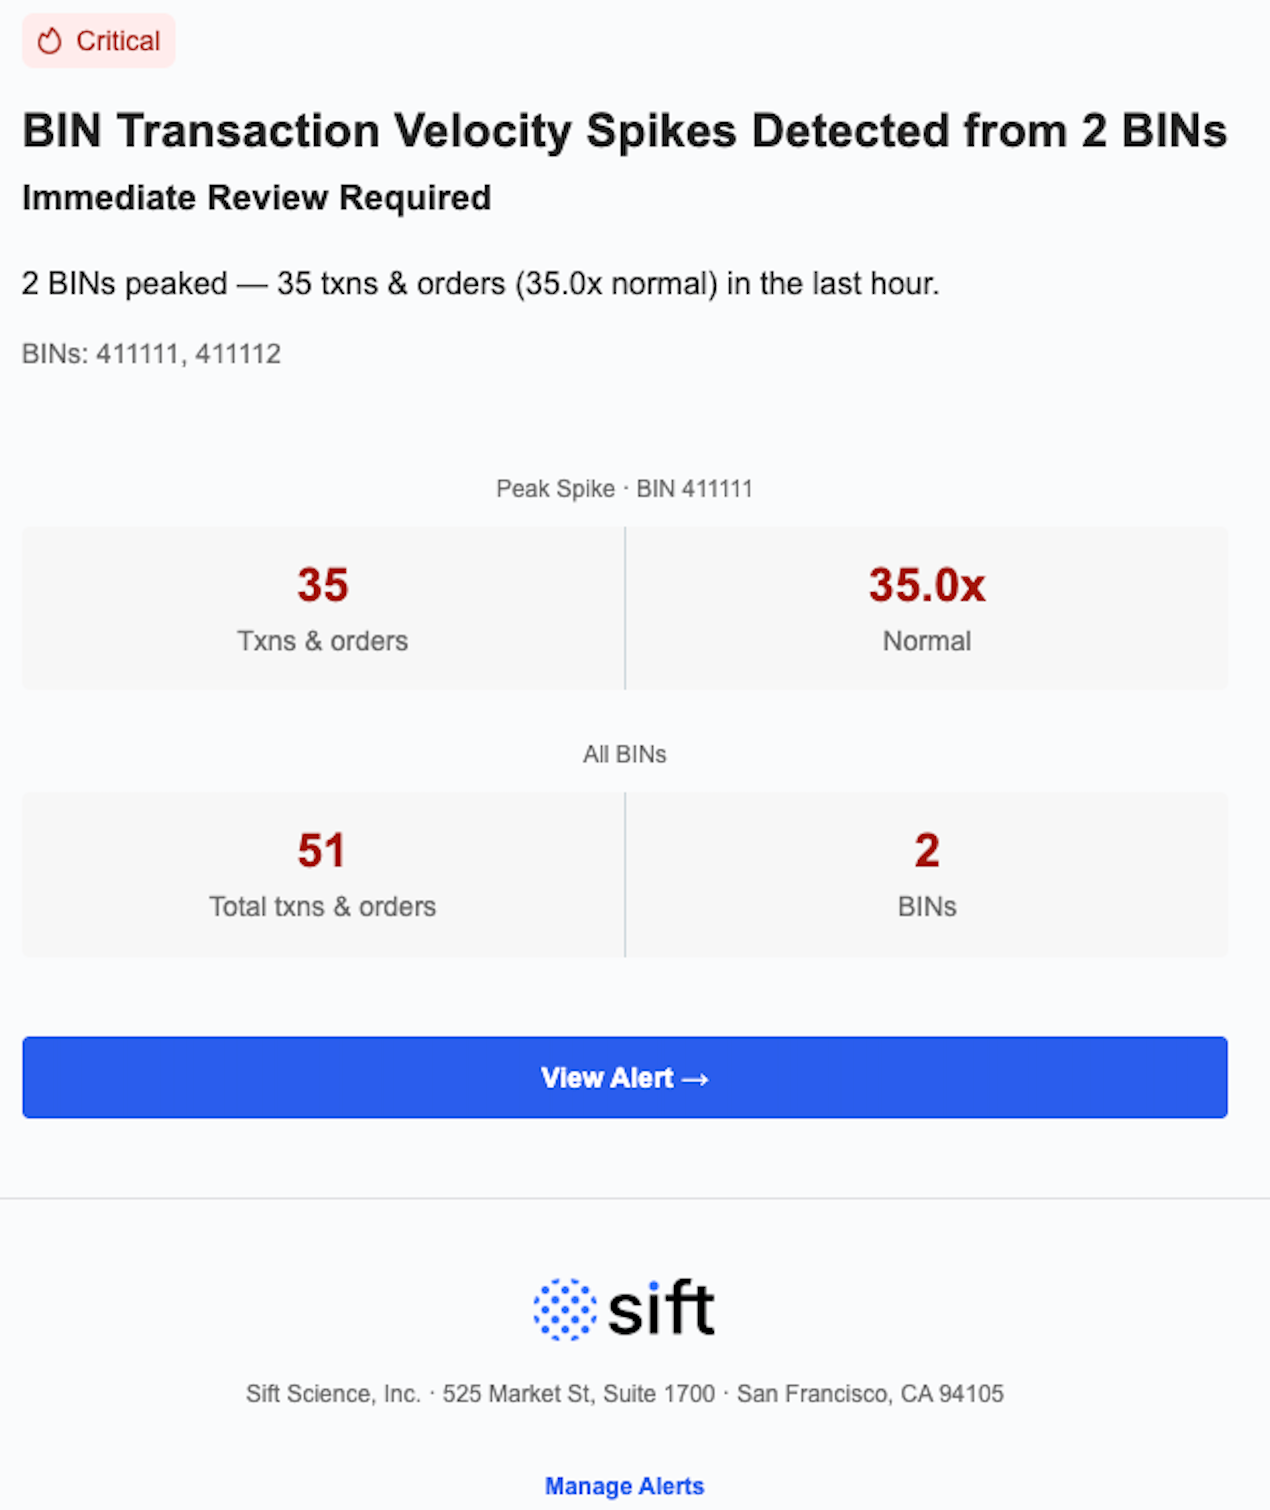
Alert about the anomaly via Email
Alert notification contains basic information about the anomaly. Here is the example for the BIN Transaction velocity spikes:
The Console: Making Detections Actionable
A detection and an alert record are only part of the story, someone has to actually look at it and decide what to do. The Console layer came with its own complexity.
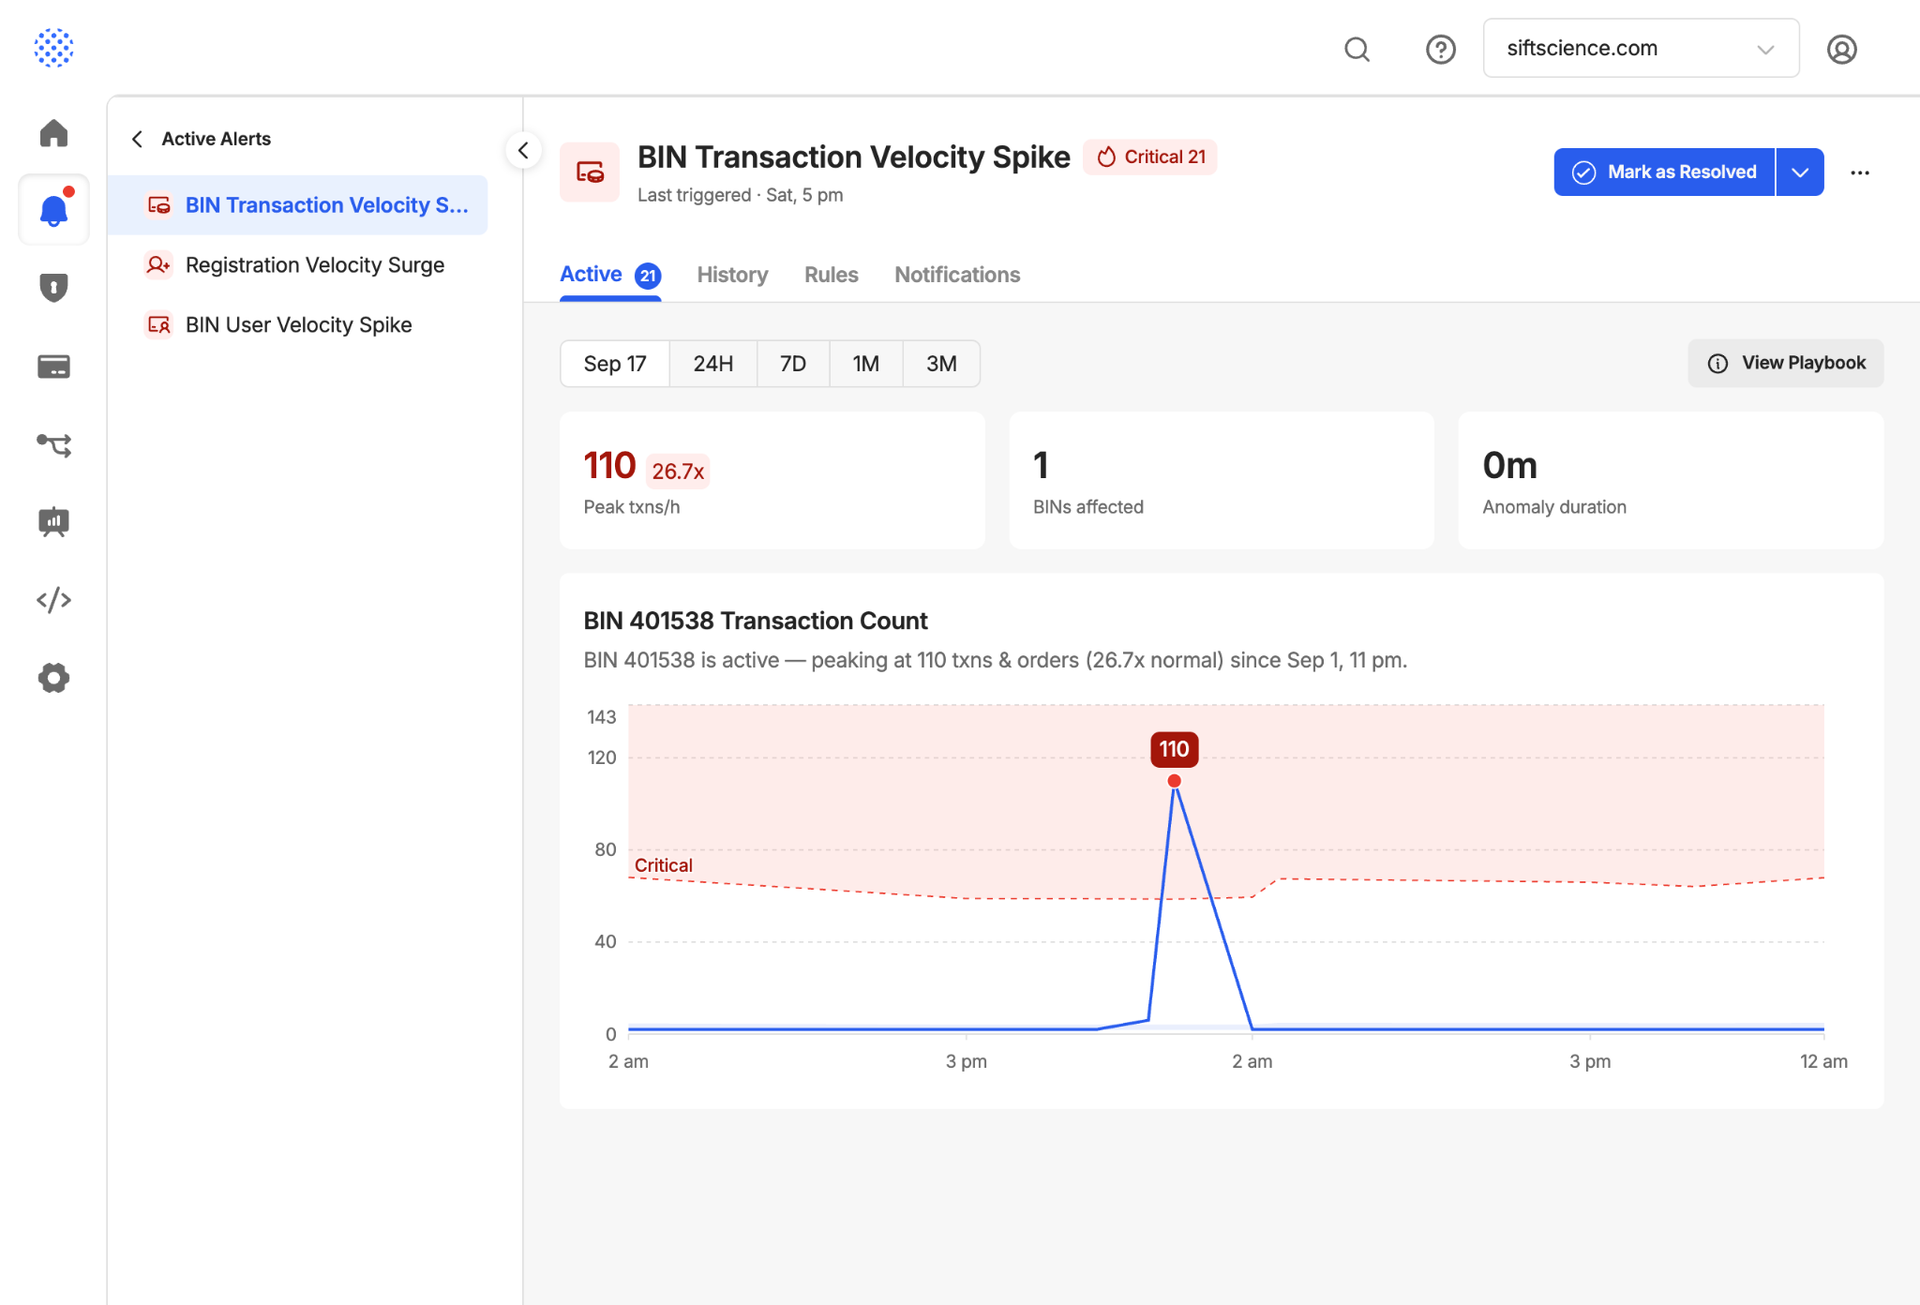
A REST API layer powers the console. A summary endpoint rolls up active-alert counts, severity breakdowns, and trend sparklines for the dashboard. A visualization endpoint returns chart-ready data per alert. This data is anomaly specific and depends on the chart type (scatter/bubble, heatmap, dual-axis, time-series, bar-line). This helps create charts that are self explanatory.
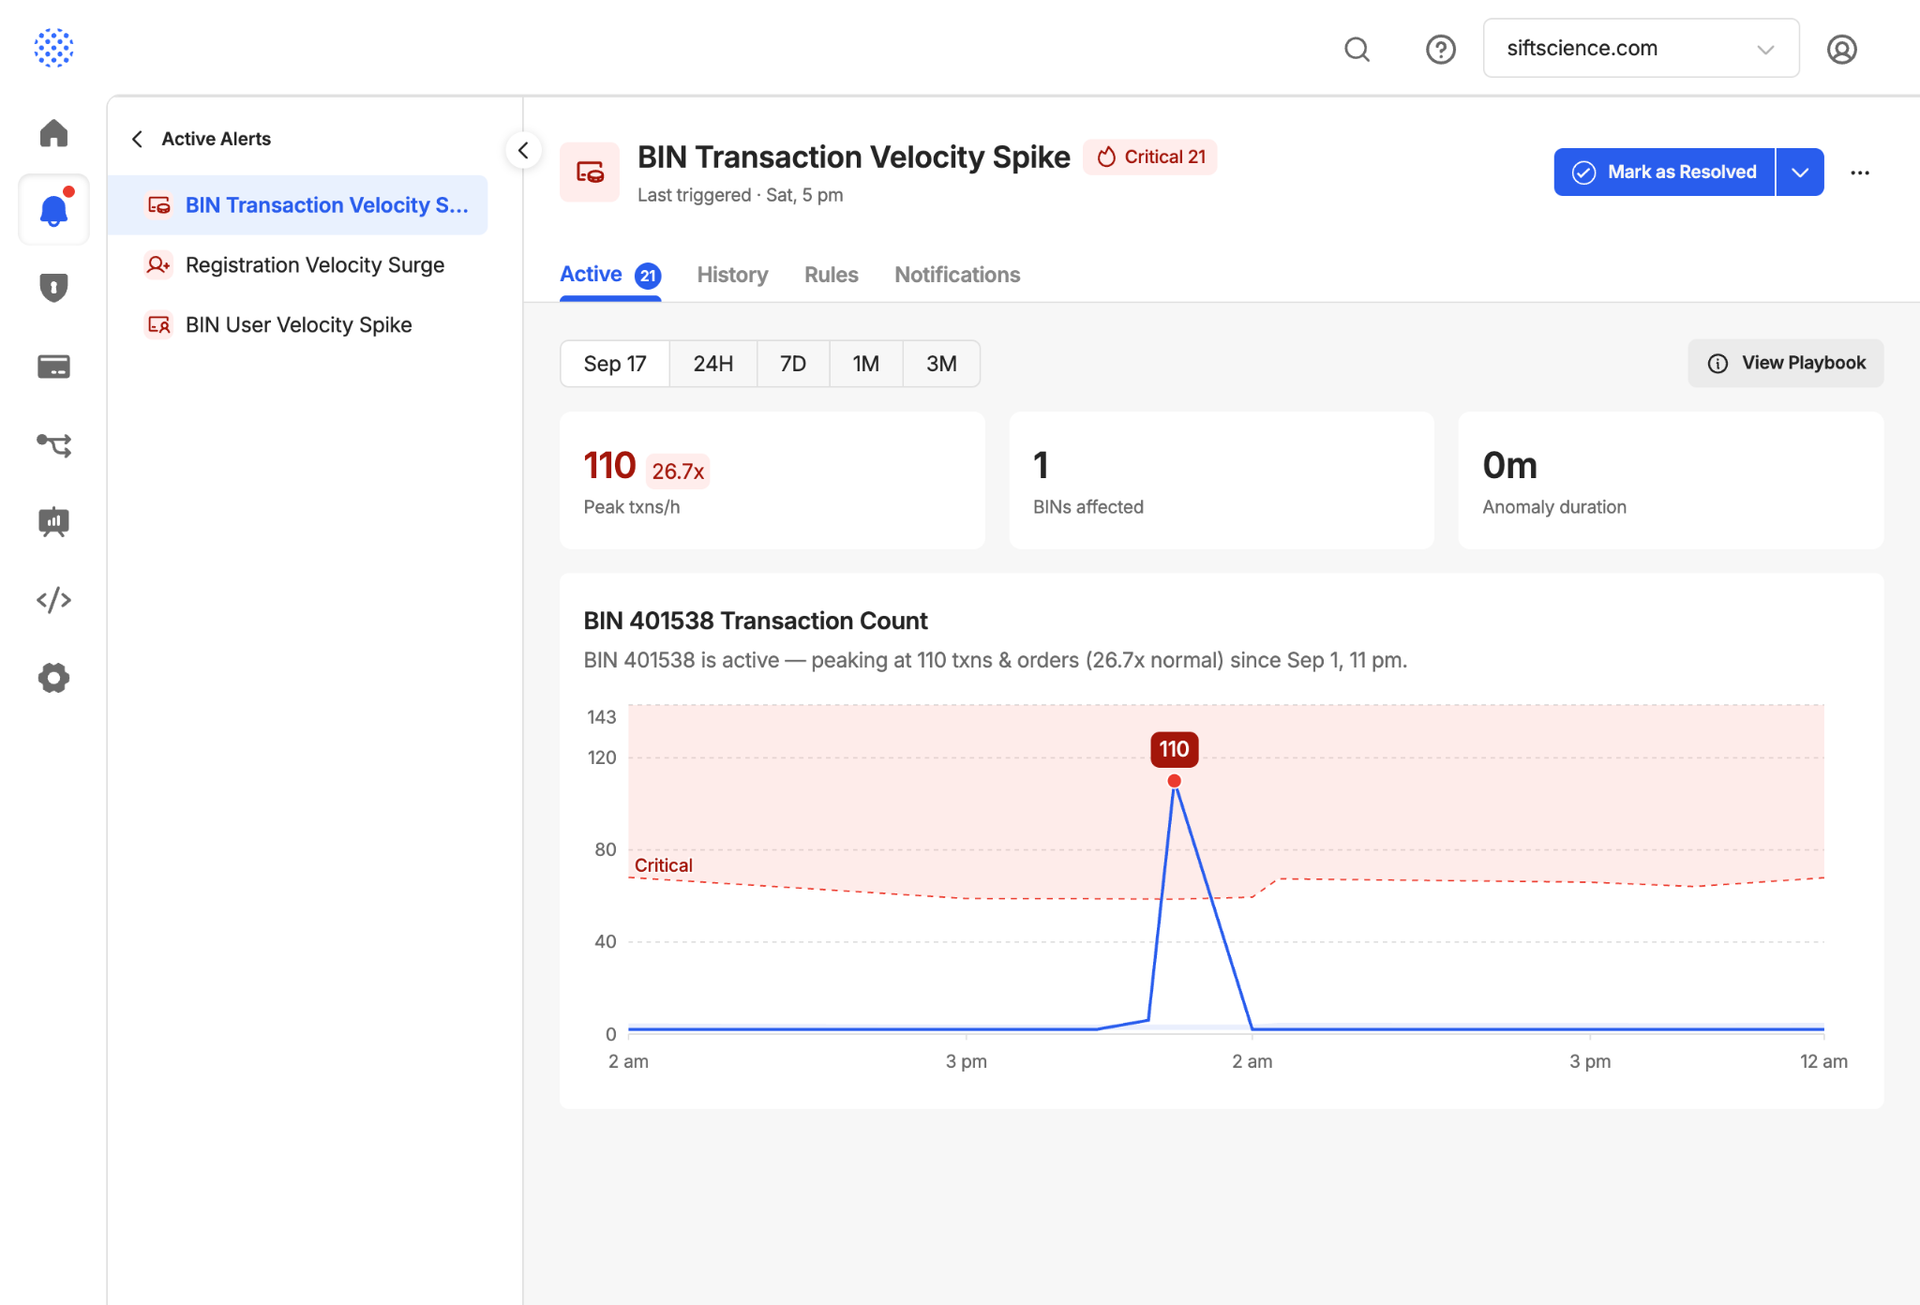
The dashboard’s main job is showing one card per active, deduplicated alert. The UI has to reconcile automatic updates from the backend with the action an analyst took (acknowledging, snoozing, resolving).
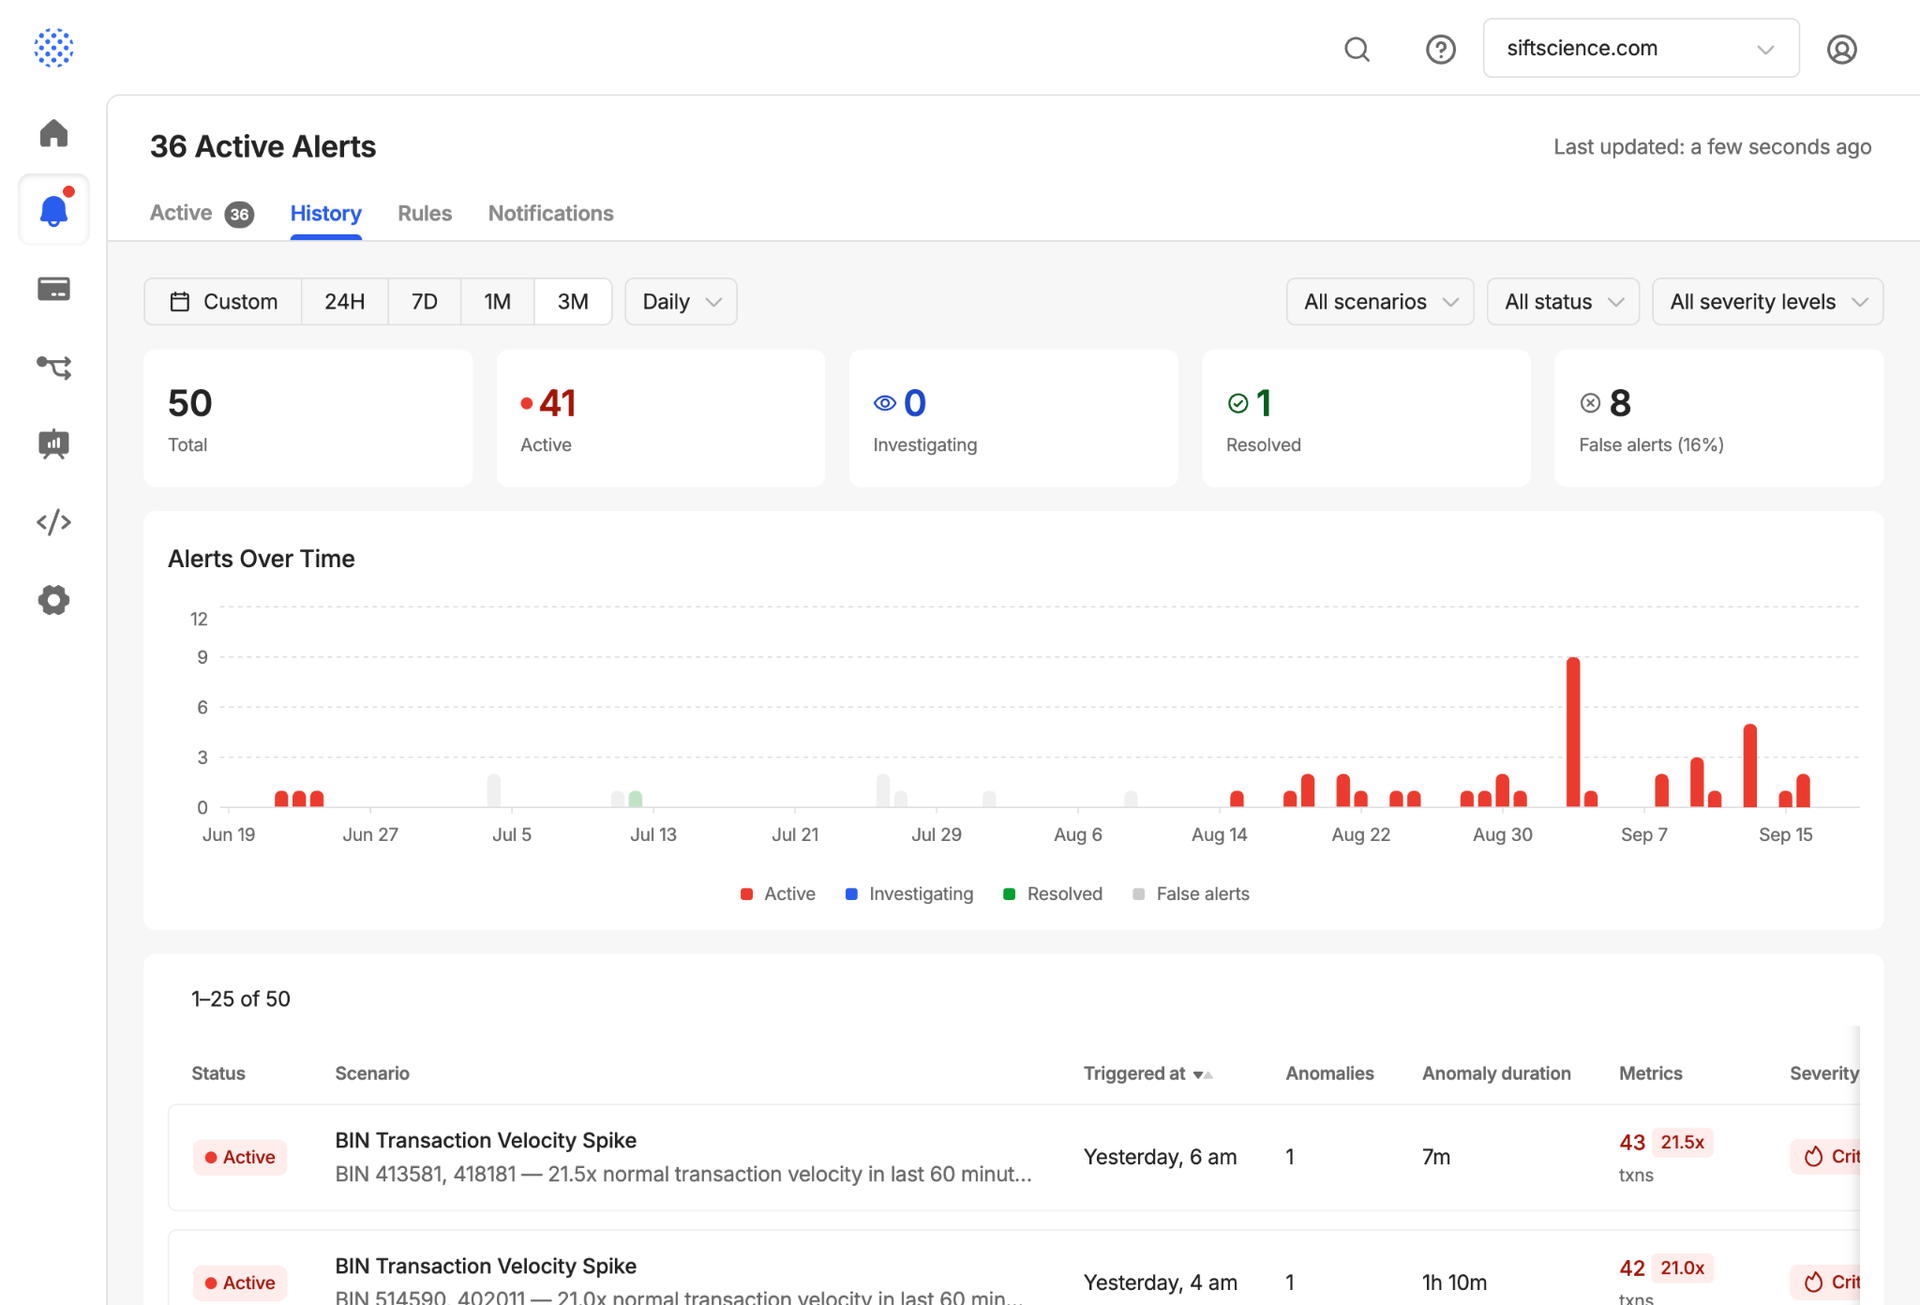
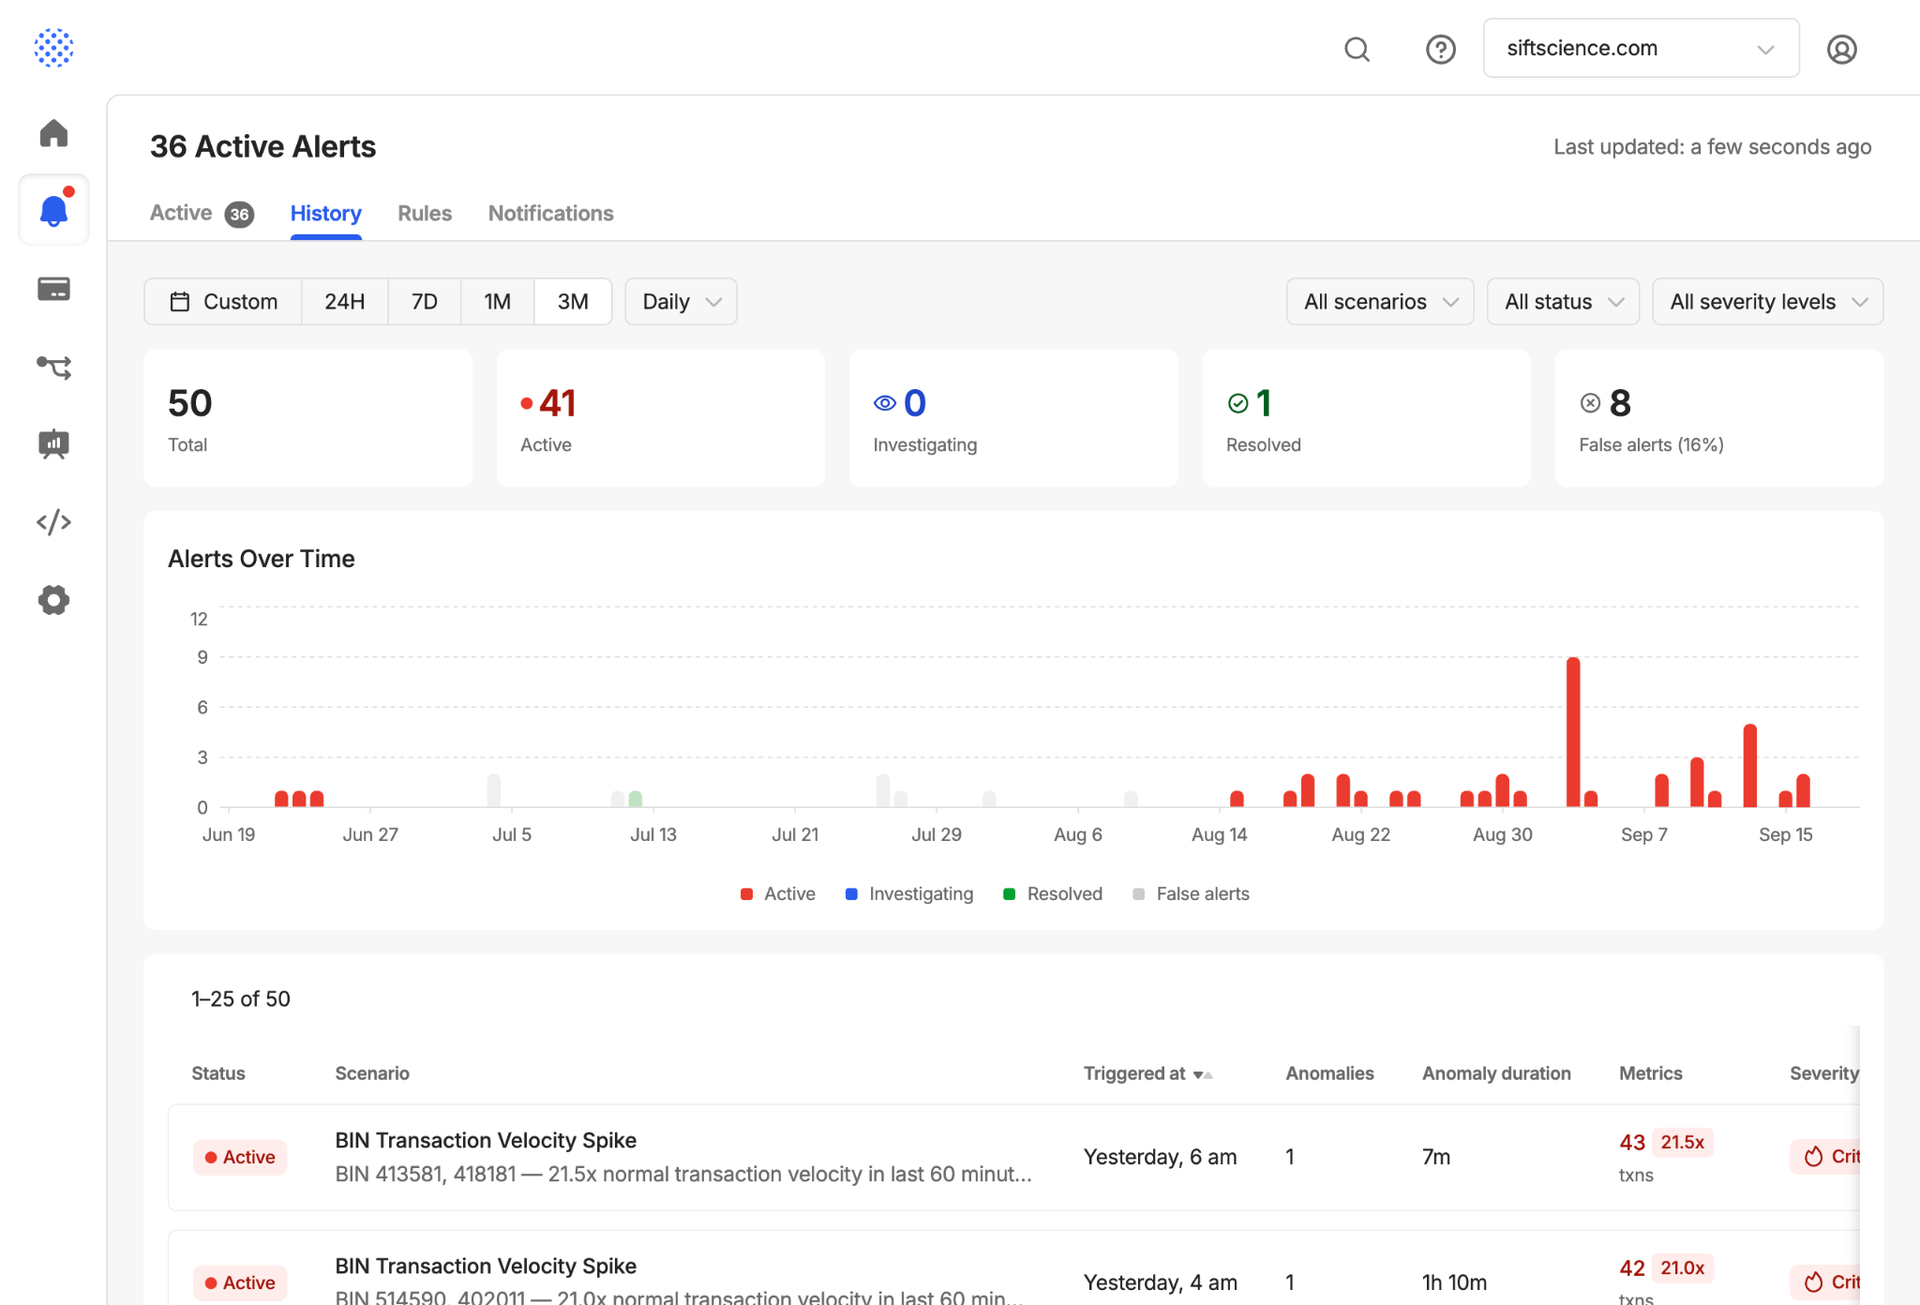
Every resolved alert needs to be tagged with feedback (true positive, false positive, duplicate) that feeds back into per-customer tuning. This helps build a history view that’s filterable enough to be useful across customers and anomaly types.
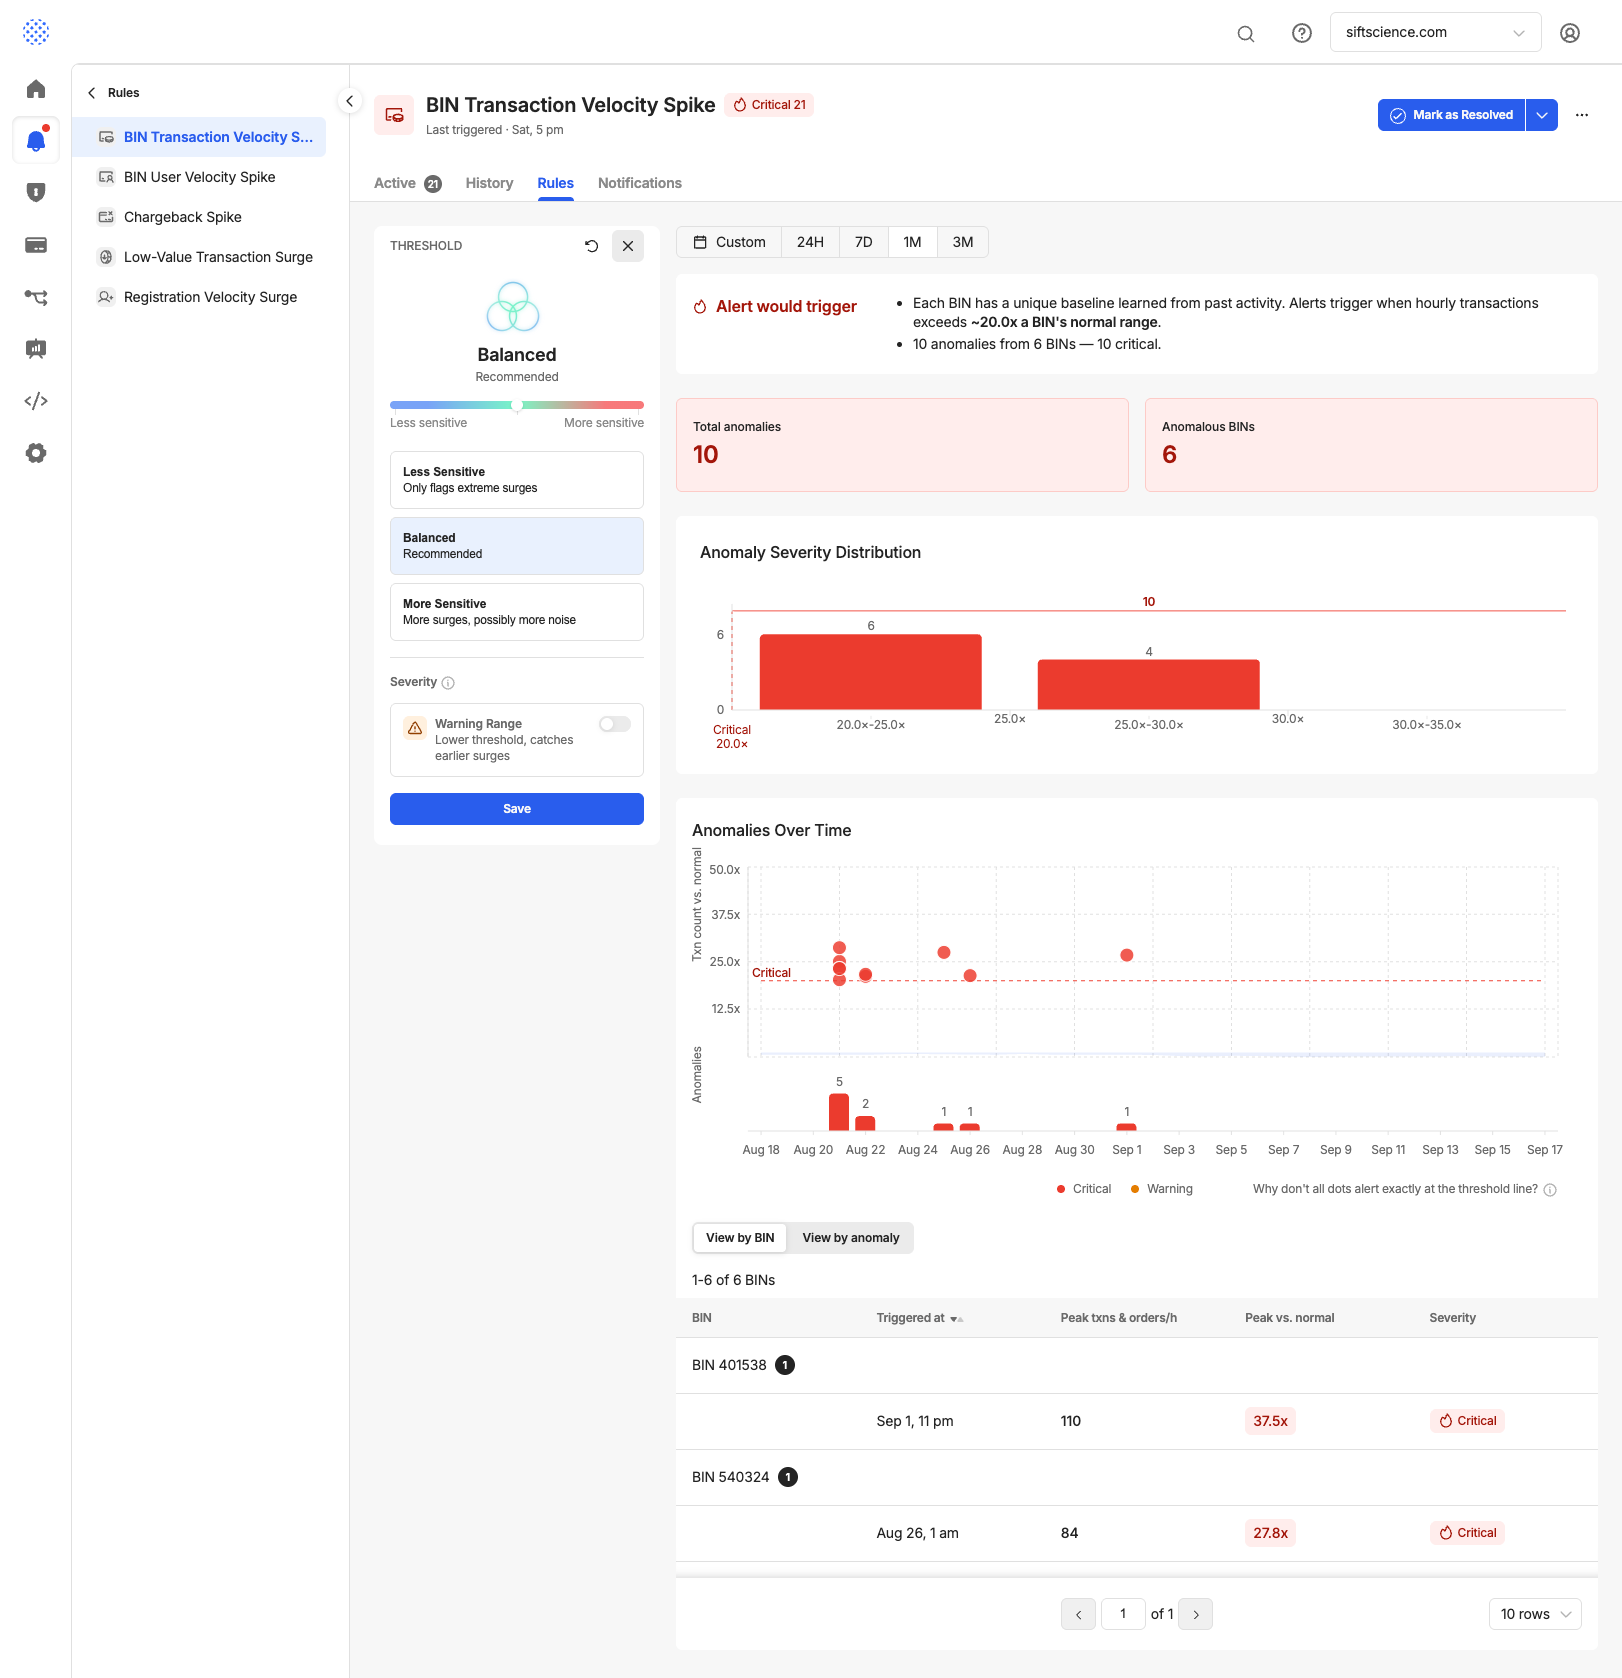
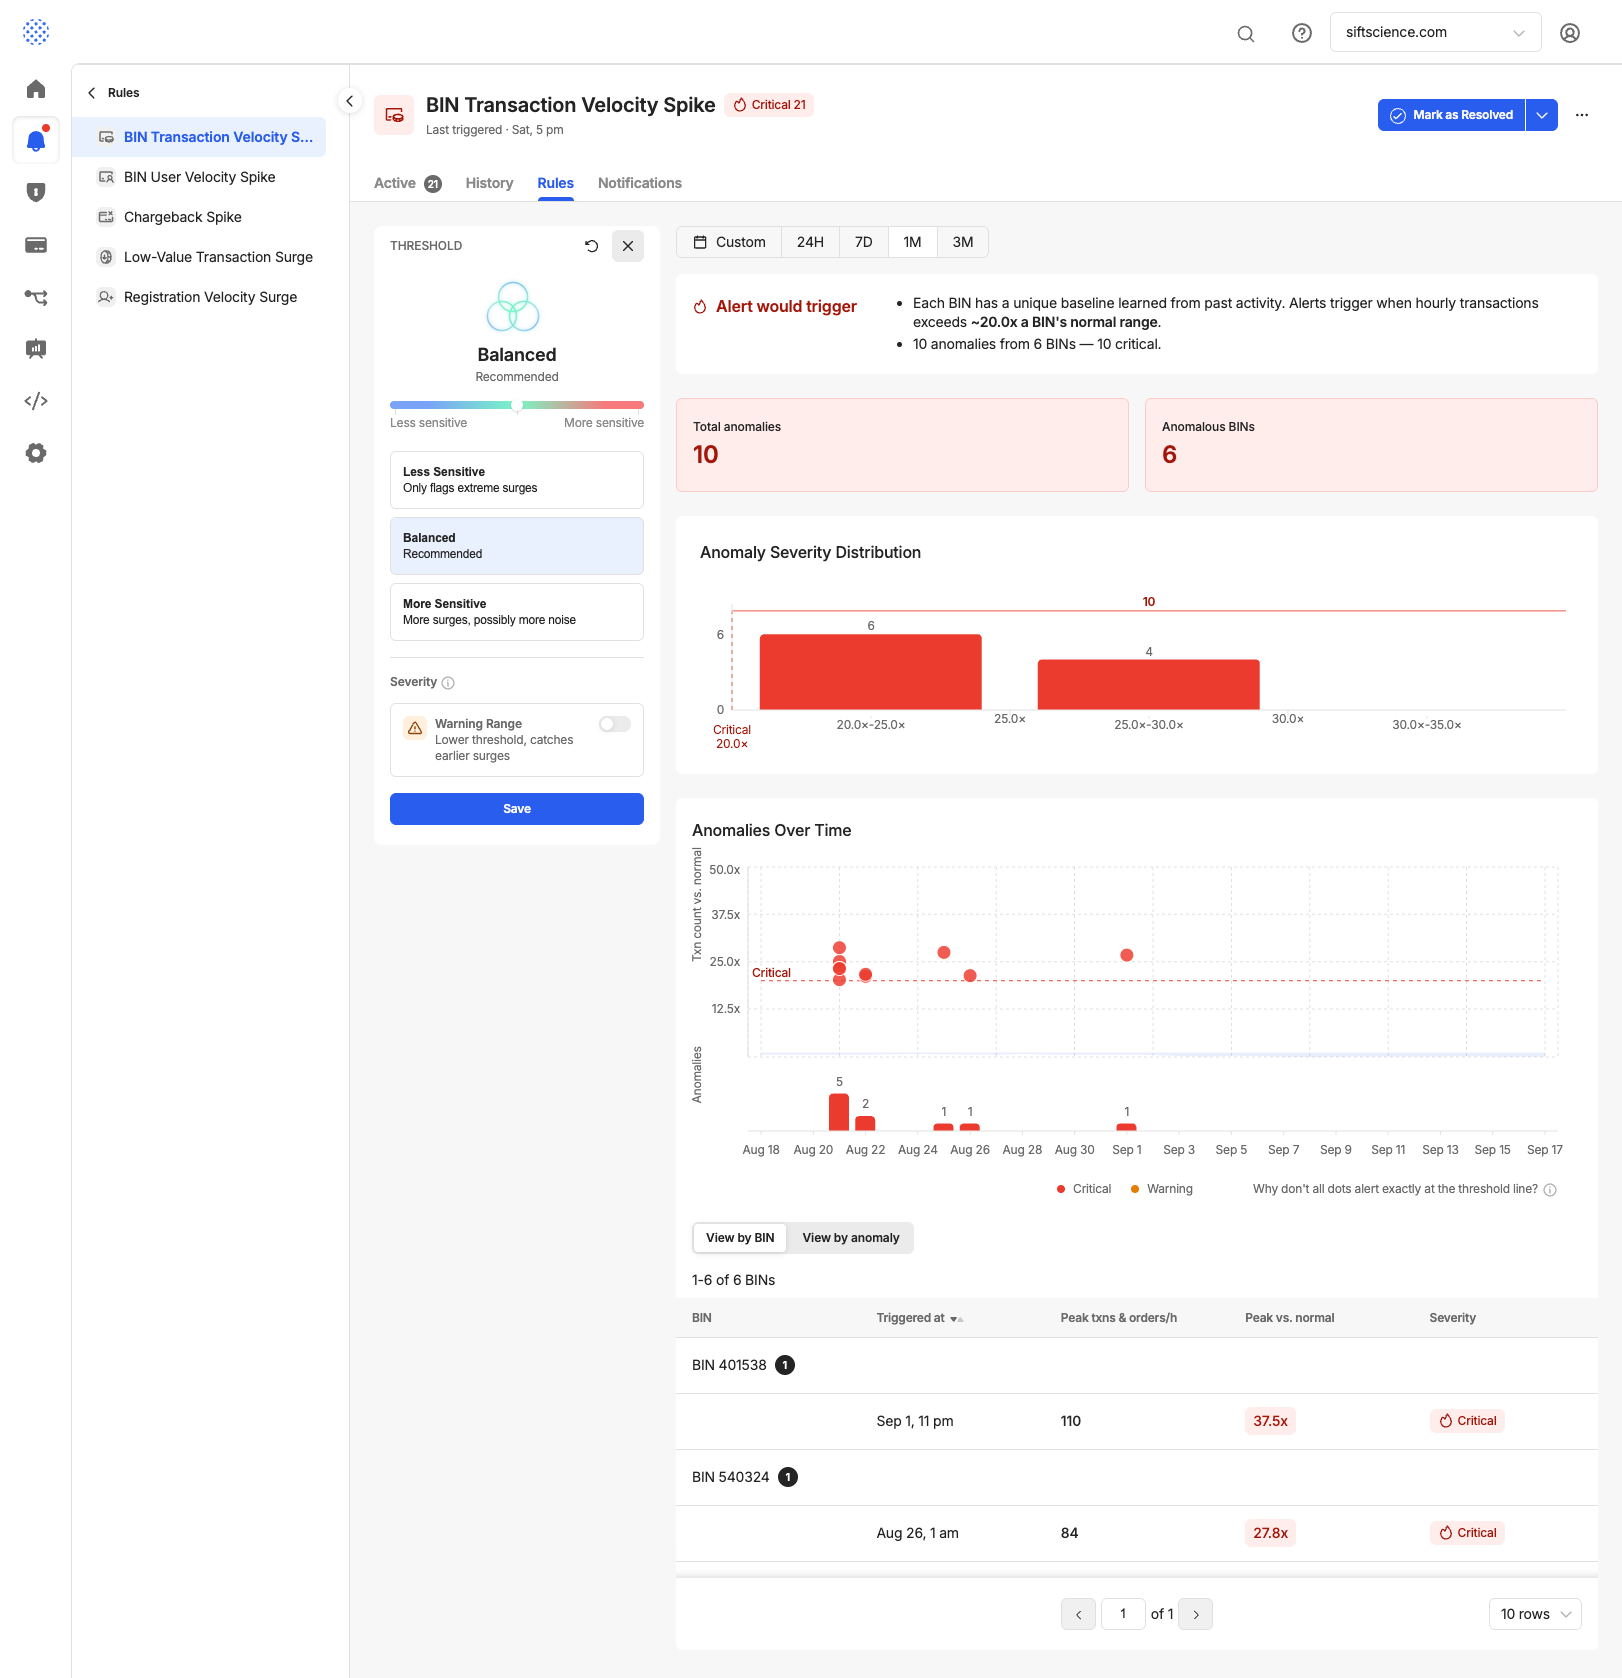
The hardest UI problem was configuration. Sensitivity is tunable per customer and anomaly type. For BIN attacks specifically, the backend tracks shared buckets by popularity plus ones for top-1%. The config page has to expose “how sensitive should this be” in a way that makes sense to a customer, without forcing them to understand bucketing.
As we built the alerting experience, we learned that this required more than simply putting detection results on a screen.
The detection pipeline is responsible for finding anomalies and maintaining their state. The Console needs to turn those signals into something an analyst can understand and act on.
One of the first questions we had to answer was how much of the detection logic should make its way into the Console. An analyst needs more than a severity, they need enough context to understand why something was considered unusual.
We designed the API around that idea. A summary endpoint provides active alert counts, severity breakdowns, and recent trends in a single call. A visualization endpoint prepares the data needed for different chart types, including time series, scatter plots, heatmaps, and bar-line charts. It also includes the relevant data points, thresholds, baselines, and forecast information, allowing the Console to render the visualization without recreating detection logic.
The same approach helps with explainability. Every anomaly includes the threshold information that was in effect when it was detected. This gives analysts the actual context behind an alert rather than simply telling them that something crossed a threshold.
Another important decision was how to represent ongoing activity. A single incident can generate many anomaly signals, but showing every signal independently would quickly make the dashboard noisy. Instead, the Console presents one deduplicated alert for the underlying incident.
For example, an ongoing BIN attack may continue generating signals as more activity is observed, but the analyst still sees a single alert. That alert can update with a new last_seen_at timestamp and additional affected entities without creating a new card for every signal.
This creates an interesting synchronization problem. The backend may update an alert at the same time an analyst is acknowledging, snoozing, or resolving it. The UI needs to reconcile those automatic updates with the analyst’s action without overwriting it or briefly showing stale information. Getting this right was important to making the Console feel reliable during an active investigation.
The story does not end when an alert is resolved. Analysts can classify an alert as a true positive, false positive, or duplicate. We preserve that feedback as part of the alert history so it can help tune sensitivity for different customers and anomaly types over time.
With many customers and multiple anomaly types, the history experience also needed to be more than a long list of past alerts. Filters make it possible to quickly narrow the results and investigate how the system has been behaving without turning the page into an unstructured log dump.
Configuration presented another challenge. Sensitivity can be adjusted per customer and per anomaly type, but the underlying detection logic can be much more complicated than the concept we want to expose.
BIN attack detection is a good example. The backend uses shared buckets based on popularity and separately models for the top 1% of BINs. Those details are important to the detection system, but customers should not need to understand bucketing, percentile calculations, or minimum-volume guards just to decide how sensitive they want the detection to be.
The Console therefore focuses on the concepts that are meaningful to the customer while keeping the implementation details behind the API. Customers see a sensitivity control and relevant safety settings such as the minimum-volume guard, while the detection system translates those settings into the underlying behavior.
Building the alerting experience showed us that detection and action are two different problems. The detection pipeline answers, “Is this behavior unusual?” The Console answers, “What does this mean, and what should I do about it?” Keeping those responsibilities separate allowed us to build a detection system focused on finding meaningful anomalies while giving analysts the context and controls they need to act on them.
Impact So Far
The Attack Detection Agent has been running in early access ahead of general availability, and the results have been encouraging. In its first month, it fired across nine customers, raised 145 anomaly alerts and flagged roughly 90 distinct card BINs. It catched patterns like a sustained transaction spike running 20x above baseline for seven hours straight, and a card-testing surge lasting 13 hours. One customer saw dozens of anomaly detections for BIN attacks (both transactions and users) over 30 days that our previous batch-based tooling would have missed entirely.
Want to Build This With Us?
This project uses a bunch of different tools: Kafka, Airflow orchestration, Spanner, a standalone gRPC service, and a fair amount of real distributed-systems thinking about deduplication and alert state. If the kind of problems in this post, like real-time systems, explainable applied ML, fighting fraud, sound like a problem you want to work on, we’re hiring. Come build the next phase with us – open reqs
Authors: Artem Dvornichenko, Dima Mostovyi, Eduard Chumak and Oleksandr Kochkodan
Edited & Reviewed: Jason Fama and Ankush Walhekar